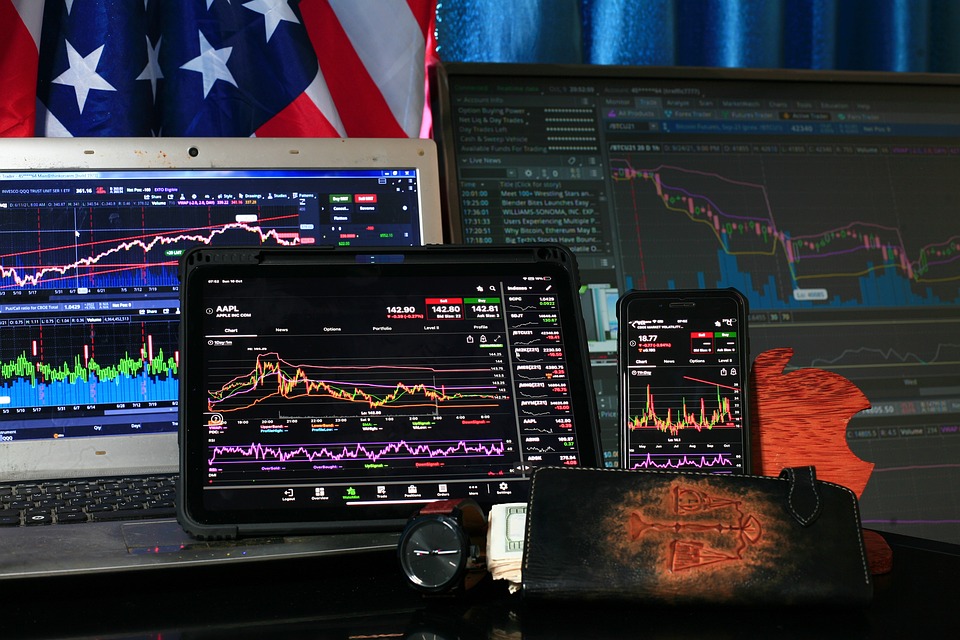
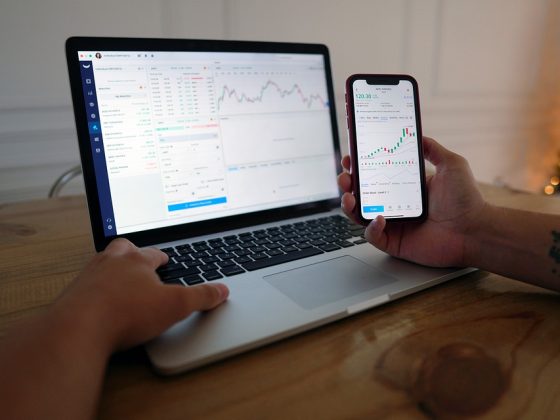
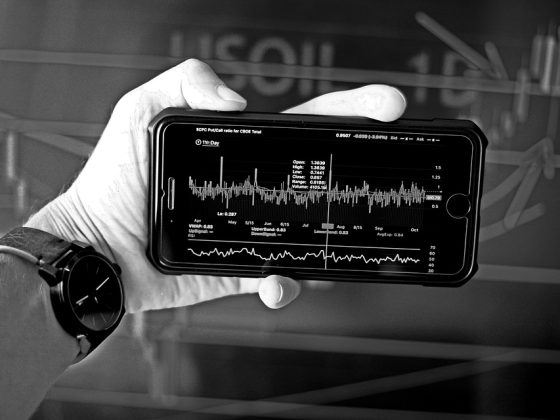
In today's fast-paced and ever-changing financial markets, staying ahead of the curve is crucial for traders and investors. Analyzing market trends with TradingView's advanced tools can provide valuable insights and help make more informed trading decisions. With a wide range of technical analysis indicators, charting tools, and customizable features, TradingView is a powerful platform that can help traders identify trends, patterns, and potential opportunities in the market.
One of the key features of TradingView is its extensive library of technical analysis tools. Traders can access a wide range of indicators, including moving averages, oscillators, volume indicators, and trendlines, to help analyze market trends and make predictions about future price movements. These indicators can be customized and combined to create unique trading strategies tailored to individual preferences and risk tolerance.
Another useful feature of TradingView is its advanced charting tools. Traders can create custom chart layouts, add multiple chart windows, and save chart templates for easy access. With real-time data and interactive charting capabilities, traders can quickly analyze market trends, track price movements, and identify potential entry and exit points. The platform also offers a wide range of drawing tools, such as trendlines, Fibonacci retracements, and pitchforks, to help traders visualize key support and resistance levels and analyze price patterns.
TradingView also provides social networking features, allowing traders to share ideas, analysis, and trading strategies with other users. By following other traders, accessing public and private chat rooms, and participating in discussions, traders can stay informed about market trends and gain valuable insights from the trading community. This collaborative approach can help traders identify new opportunities, validate trading ideas, and improve their overall performance in the market.
In addition to its technical analysis and charting tools, TradingView offers a range of fundamental analysis features that can help traders evaluate the financial health and performance of companies. Traders can access company financials, earnings reports, and analyst ratings, as well as economic data and news feeds, to stay informed about market developments and make well-informed investment decisions. By combining technical and fundamental analysis, traders can gain a comprehensive understanding of market trends and potential trading opportunities.
FAQs
Q: What are some of the most popular technical analysis indicators available on TradingView?
A: Some of the most popular technical analysis indicators on TradingView include moving averages, relative strength index (RSI), stochastic oscillator, MACD, Bollinger Bands, and Fibonacci retracements. These indicators can help traders analyze market trends, identify potential entry and exit points, and make informed trading decisions.
Q: How can I customize and save my chart layouts on TradingView?
A: To customize and save your chart layouts on TradingView, simply select the indicators, drawing tools, and chart settings you want to use, and then save your chart layout as a template. You can save multiple chart layouts and easily switch between them to analyze different markets or trading strategies.
Q: How can I access company financials and fundamental analysis data on TradingView?
A: To access company financials and fundamental analysis data on TradingView, simply search for the company you want to analyze, and then navigate to the “Fundamentals” tab on the company profile page. Here, you can view key financial metrics, earnings reports, analyst ratings, and other fundamental data to help you evaluate the company's performance and make investment decisions.
In conclusion, analyzing market trends with TradingView's advanced tools can provide traders with valuable insights and help make more informed trading decisions. With a wide range of technical analysis indicators, charting tools, and customizable features, TradingView offers a powerful platform for traders to analyze market trends, identify potential opportunities, and improve their overall trading performance. By combining technical and fundamental analysis, traders can gain a comprehensive understanding of market trends and make well-informed investment decisions.


